What’s in a margin?
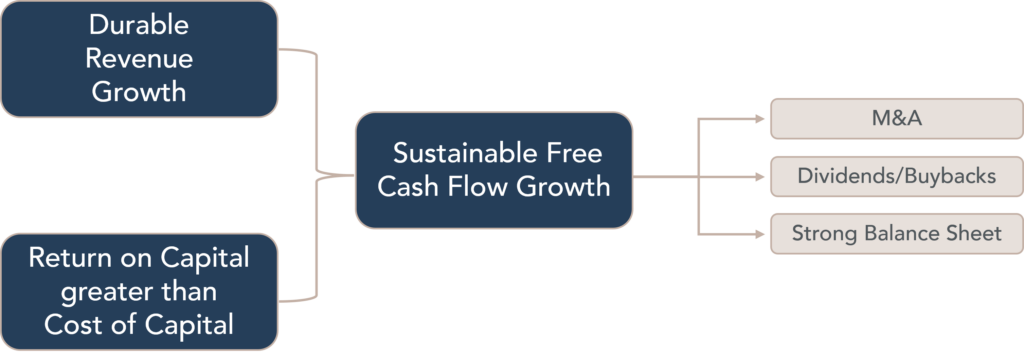
Profit margins are sometimes spoken of as synonymous with business quality; high margins = good, low margins = bad. The reality is more nuanced, and a given level of margins in isolation informs little about a company’s ability to create value. Instead, we believe that growth in free cash flow is the long-term source of value creation and share prices. This itself depends on a company’s ability to grow, whilst earning a return on invested capital (ROIC) in excess of the cost of capital.

ROIC is a simple but powerful number, capturing both a company’s profit margins and how effectively they generate revenues on their capital investments, known as ‘asset turn’[1]. We can break down the formula for ROIC into these two components as outlined below:

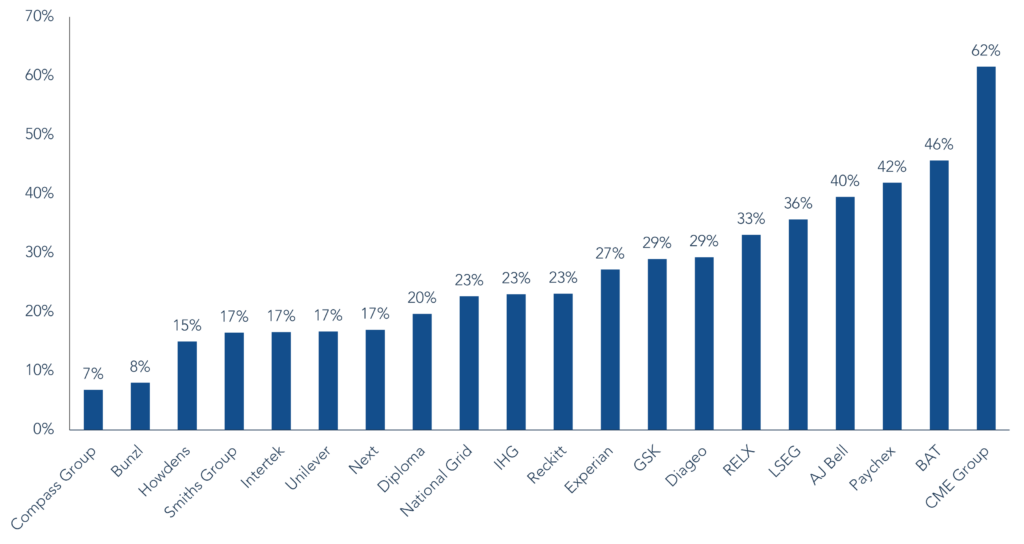
This formula is very helpful because it tells us that margins are only half the story. In your Fund we see a range of different operating profit margins:
Top 20 holdings: Operating profit margins

Source: FactSet, 31 August 2024. Past performance is not a guide to future performance.
Companies that have low margins can still earn an attractive ROIC if they generate a high rate of sales relative to their invested capital. Compass Group, the portfolio holding with the lowest margin, is an excellent example of just this. Despite its low margins, its high asset turn means that it generates a ROIC which is comparable to a higher margin company such as Intertek.
| Asset turn | Operating profit margin | ROIC (pre-tax) | |
| Compass | 3.8x | 6.8% | 25.8% |
| Intertek | 1.6x | 16.6% | 27.2% |
Source: FactSet, 31 August 2024. The reference to specific securities is not intended as a recommendation to purchase or sell any investment.
Along with Compass, Bunzl is the other company that stands out in having the lowest margin in the fund. These are both B2B service businesses; Bunzl distributes numerous everyday products to numerous customers across different industries. Compass is the world’s largest outsourced catering company, sourcing and buying more food globally than any other peer. We find similarly low margins among other UK ‘distribution’ type businesses that we follow but do not own, such as RS Group and DCC. Looking further afield, we would highlight comparable US businesses like Ferguson or Sysco, or perhaps even US retailers such as Wal-Mart and Costco.
| Company | Operating profit margin |
| RS Group (formerly Electrocomponents) | 11% |
| DCC | 3% |
| Ferguson | 10% |
| Sysco | 4% |
| Wal-Mart | 4% |
| Costco | 3% |
Source: FactSet, 31 August 2024. The reference to specific securities is not intended as a recommendation to purchase or sell any investment.
What unites these successful businesses is that they are all involved in the purchase and distribution of high volumes of third-party physical products at scale. In so doing, they rely on good asset turnover, not just margins, to generate attractive ROICs.
The owner of a strong brand tends to have a high gross margin – the customer perceives some intangible value from the brand and so is willing to pay a premium relative to the tangible cost of manufacture. Hence, a luxury handbag may sell for a £1,000 but the all-in costs to produce and distribute it might only be £300, giving a 70% gross margin (this is what high-end luxury brand Hermès earns). We can refer to such businesses as having a ‘price-led’ advantage.
Conversely, companies like Bunzl and Compass do not earn this brand margin, but instead play a valuable role by efficiently distributing high volumes of third-party product while offering various other ‘value-add’ services. Their advantage is ‘cost-led’ as they can perform this role with greater cost efficiency than peers or alternative routes. This result is lower gross (and operating) margins but the benefits of scale, along with good asset efficiency, can still make for highly attractive ROICs.
Why look at margins at all?
So are low margins no cause for concern? There are still important considerations. One intuitive risk is that a low margin company could more easily go loss-making versus a high margin one. In particular, if you have a lot of fixed costs (for example, rented buildings and staff that you must retain), a fall in sales leads to more aggressive declines in profit. The basic example below shows the dramatic 200% fall in profit (to a loss) for a low margin business vs the 20% fall for a high margin one based on the same 10% decline in revenues and a fully fixed cost base. Of course, conversely, a rise in sales benefits the low margin company more than the high margin one in this example.
| Low margin Year 1 | Low margin Year 2 | High margin Year 1 | High margin Year 2 | |
| Revenue % growth | 100 | 90 -10% | 100 | 90 -10% |
| Costs (all fixed) | -95 | -95 | -50 | -50 |
| Profit % margin % growth | 5 5% | -5 -6% -200% | 50 50% | 40 44% -20% |
Therefore, in order to get comfortable with low margin businesses it is vital we understand the stability and growth of revenue as well as the shape of costs and margins (and ultimately ROICs) over time.
Compass and Bunzl give us comfort on both fronts. One of the great attractions of these businesses is they are among the most stable in difficult economic environments; organic revenue growth was -1% and 0% for Bunzl and Compass respectively in 2009 (during the Financial Crisis), while overall revenues and profits grew in both cases. Both companies fall into one of our favoured investment themes of B2B service businesses providing vital, low-cost services. So long as their customers are operating, the demand for their products will remain; for example, a hospital still needs to buy its PPE and cleaning materials (Bunzl) and run its catering service (Compass). Consistent demand leads to a highly stable P&L, providing reassurance on their lower margins.
The nature of their businesses means the majority of costs are variable not fixed. For Compass, a significant expense is the purchase of food. If customer demand falls, this cost falls in tandem. They can also flex the other major cost items such as staff, either in terms of their variable pay or numbers of employees. By some estimates, as much as 80% of Compass’s total costs could be varied with revenues, creating a defensive profit profile in difficult conditions.
We could contrast this shape for instance with something like a retailer needing a large rented physical store base and operating in a more fickle product sector such as consumer fashion. They are likely to see more variable revenue/demand and have less flexibility in their cost base. Even retailers that also own their own brands, and so tend to have higher margins, can suffer dramatic shifts in profitability when customer demand declines. We have seen this dynamic play out again and again across the sector over the past 15 years.
Scale begets scale
Returning to Bunzl and Compass, their competitive positions within their sectors are very important. ‘Scale’ is a commonly cited source of competitive advantage and arguably at risk of being overly used. But in these industries where being the lowest cost provider is vital, it is a potent benefit.
Compass’s catering operation is c.1.6x larger than the #2 player, and c.2.3x the #3 player globally. In the key US market, they are bigger than the next two competitors combined. Compass buys more food produce than anyone else, enabling them to negotiate more favourable terms with their suppliers. Interestingly, they procure food not only for themselves but also for numerous third parties such as restaurant and hotel chains (among many others). This is a symbiotic relationship, with both parties benefiting from the enhanced buying power in the form of lower input costs. Cost is one of the most important considerations for Compass’s customers, for whom catering is not a core business function. The ability to reduce costs is a core driver for them to outsource catering; by shifting to Compass customers can regularly save c.30%. The fact that Compass buys food at better prices than peers means their cost savings to the customer can exceed the competition. And even while being able to offer competitive prices to customers, Compass’s scale still contributes to the company having the highest margin vs their peers (high margins in an industry context, despite being low vs other industries). This creates a powerful virtuous cycle:
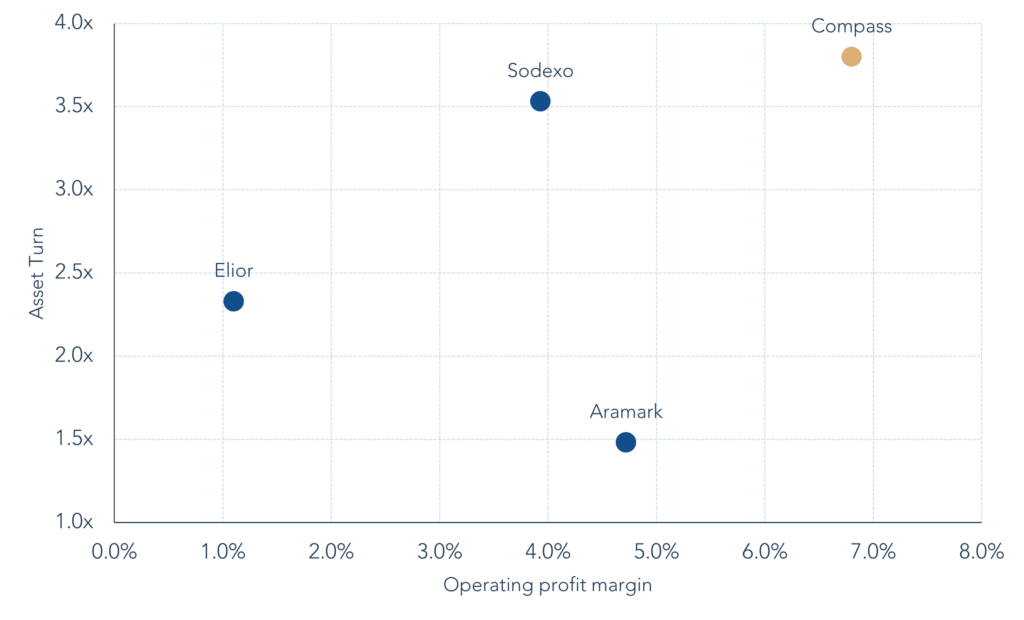
Better prices from suppliers fuel new customer wins as well as higher profits, enabling superior reinvestment into sales, technology, and productivity, in turn driving higher growth, market share, and profitability. The result is that Compass grows revenues at faster rates than peers and at materially higher ROICs (see chart and table below). And because of the self-reinforcing scale advantage, it is hard for competitors to catch-up with Compass’s leadership position.
Compass vs Peers

| Company | ROIC |
| Compass | 26% |
| Sodexo | 14% |
| Aramark | 7% |
| Elior | 3% |
Source: Company documents and Bloomberg, 31 August 2024. Past performance is not a guide to future performance. Showing FY23 numbers.
Beyond scale
Of course, Compass’s success as an investment is not just about scale in isolation. There are many other important factors and we highlight a few below:
- The long runway for growth. As noted, a sustainable source of revenue growth is the other vital component for long-term value creation. Even with the long history of the outsourced catering industry, still only c.50% of Compass’s addressable customers currently outsource their catering, despite the clear benefits. This reassures us on the breadth of industry growth still to go for.
- It is a hard business to disrupt.
- Compass has physical presence and distribution across 45 countries, with 55,000 client locations, >560,000 employees, and they aggregate food and related products from thousands of suppliers globally. While Compass is not a ‘capital-intensive’ business, the cumulative build out of its infrastructure cannot be quickly replicated. Similarly, the cultivation of numerous customer and supplier relationships reflects decades of work.
- Not only is reproducing Compass’s position difficult, but contract catering is far from a ‘hot’ industry. It could be considered a less ‘innovative’ industry than others, but equally it has a low risk of technological disruption/obsolescence. It does not attract the same attention of venture capital and private equity as other more ‘exciting’ sectors. This lack of investment reduces the risk of new competitive threats.
- Compass plays a vital role for suppliers, providing them access to a global customer base in the most efficient way. Instead of all suppliers needing to build their own distribution networks, the whole chain becomes more efficient by many parties consolidating into Compass’s network. Compass enables suppliers to focus on their core business – developing their products/brands.
- Compass’s services are truly value-add – they are not like ‘break bulk’ distributors that buy in bulk and simply sell-on the same products. The latter businesses tend to struggle to make an attractive ROIC. Compass simplifies a complex, but non-core, activity for businesses, saving them time and money. Compass has deep industry expertise in running effective catering. This incorporates numerous facets including health & wellbeing decisions on food choice, sustainability and ethical considerations, staffing & training, supply chain resilience, auditing of suppliers, and offering digital capability (client apps, data & insight for reporting, compliance etc). Their valued role is reflected in their almost 97% retention of customers in any given year (whilst also winning new ones).
- Other intangibles. Simply being the largest is no guarantee of ongoing success. Undoubtedly Compass has benefitted from the quality of its management team along with the wider culture and strategy of the business. They have proven adept at operational excellence and innovation for many years. Compass combines the best of centralisation and de-centralisation. They use their combined scale to procure food on favourable terms, but the group consists of numerous individual operating companies specific to particular customer industries and geographies. These each have their own brands, autonomy, and industry experts to develop the best operations for their particular niche.
Summary
Hopefully it is clear why such companies are in your Fund and why margins in isolation tell only half the story and need to be placed in context. We particularly value the consistency of businesses like Bunzl and Compass. They rarely offer ‘blow out’ surprise results to the market, but they make steady, resilient progress each year – gaining a bit more market share, becoming slightly more efficient, finding new growth opportunities, all while generating attractive ROICs and genuinely excess cash flow. Such ‘incrementalism’ leads to true compounding over time and is why they are natural fits for Troy’s UK Income strategy.
[1] To give a simplified example, for a maker of widgets the main capital investments might be a factory and related working capital (such as inventory). Asset turn simply measures how much revenue they generate relative to the value of these assets.
Disclaimer: The information shown relates to a mandate which is representative of, and has been managed in accordance with, Troy Asset Management Limited’s UK Income Strategy. This information is not intended as an invitation or an inducement to invest in the shares of the relevant fund. Performance data provided is either calculated as net or gross of fees as specified in the relevant slide. Fees will have the effect of reducing performance. Past performance is not a guide to future performance. All references to benchmarks are for comparative purposes only. Overseas investments may be affected by movements in currency exchange rates. The value of an investment and any income from it may fall as well as rise and investors may get back less than they invested. Neither the views nor the information contained within this document constitute investment advice or an offer to invest or to provide discretionary investment management services and should not be used as the basis of any investment decision. There is no guarantee that the strategy will achieve its objective. The investment policy and process may not be suitable for all investors. If you are in any doubt about whether investment policy and process is suitable for you, please contact a professional adviser. References to specific securities are included for the purposes of illustration only and should not be construed as a recommendation to buy or sell these securities. Although Troy Asset Management Limited considers the information included in this document to be reliable, no warranty is given as to its accuracy or completeness. The opinions expressed are expressed at the date of this document and, whilst the opinions stated are honestly held, they are not guarantees and should not be relied upon and may be subject to change without notice. Third party data is provided without warranty or liability and may belong to a third party. All references to FTSE indices or data used in this presentation is © FTSE International Limited (“FTSE”) 2024. ‘FTSE ®’ is a trade mark of the London Stock Exchange Group companies and is used by FTSE under licence. Issued by Troy Asset Management Limited, 33 Davies Street, London W1K 4BP (registered in England & Wales No. 3930846). Registered office: 33 Davies Street, London W1K 4BP. Authorised and regulated by the Financial Conduct Authority (FRN: 195764) and registered with the U.S. Securities and Exchange Commission (“SEC”) as an Investment Adviser (CRD: 319174). Registration with the SEC does not imply a certain level of skill or training. Any fund described in this document is neither available nor offered in the USA or to U.S. Persons. © Troy Asset Management Limited 2024.


