The Rise of Intangibles
There has been a long-term shift from tangible to intangible investment in our global economies. Investments used to be predominantly physical – machinery, buildings, vehicles, infrastructure – but an ever-increasing proportion is now intangible such as in software, R&D, datasets, brands, patents, and novel business practices. This reflects the emergence of new industries and decline of others, but also the evolution of longstanding ones, most dramatically because of technology. In the US, tangible investment was roughly double that of intangible investment in the 1970s, today that ratio has flipped. The UK exhibits a similar trend with intangible investment overtaking tangible in the late 1990s.[1] A simple measure of the market value in tangible vs intangible assets in the US illustrates the clear trend:
Components of S&P 500 Market Value
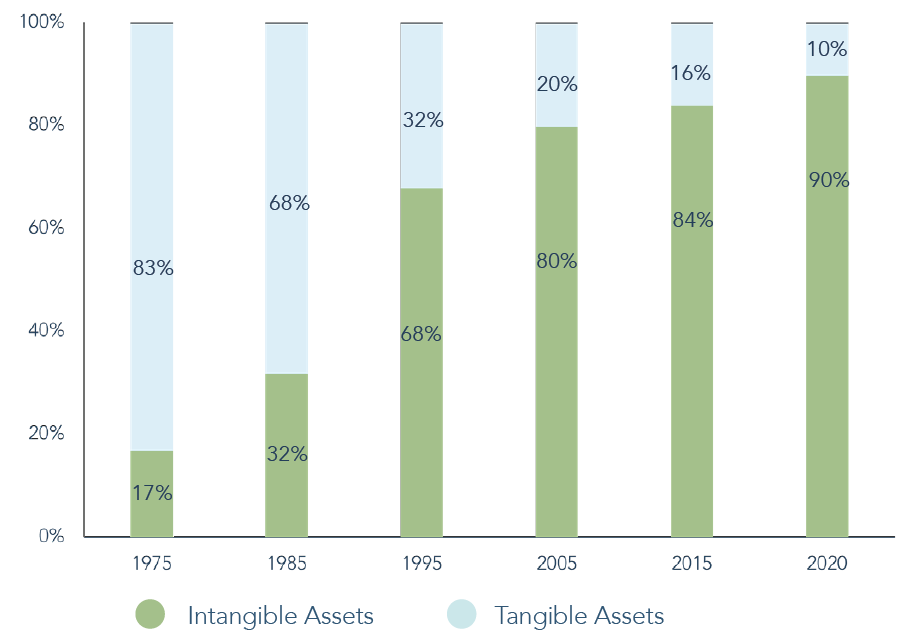
Source: Ocean Tomo, a part of J.S Held, Intangible Asset Market Value Study, 2020. Intangible asset market value is determined by subtracting a company’s net tangible asset value from its market cap.
Why We Like Them
Troy’s portfolios favour intangible-heavy companies for their durability and financial characteristics. In particular, we see intangible assets as key in generating attractive returns on invested capital (ROIC) with high persistence and low variability. We can see this resilience in the chart below, where intangible-led industries demonstrate higher long-term returns on invested capital vs those more tangible-led.
Long-term Median Annual ROIC by Industry
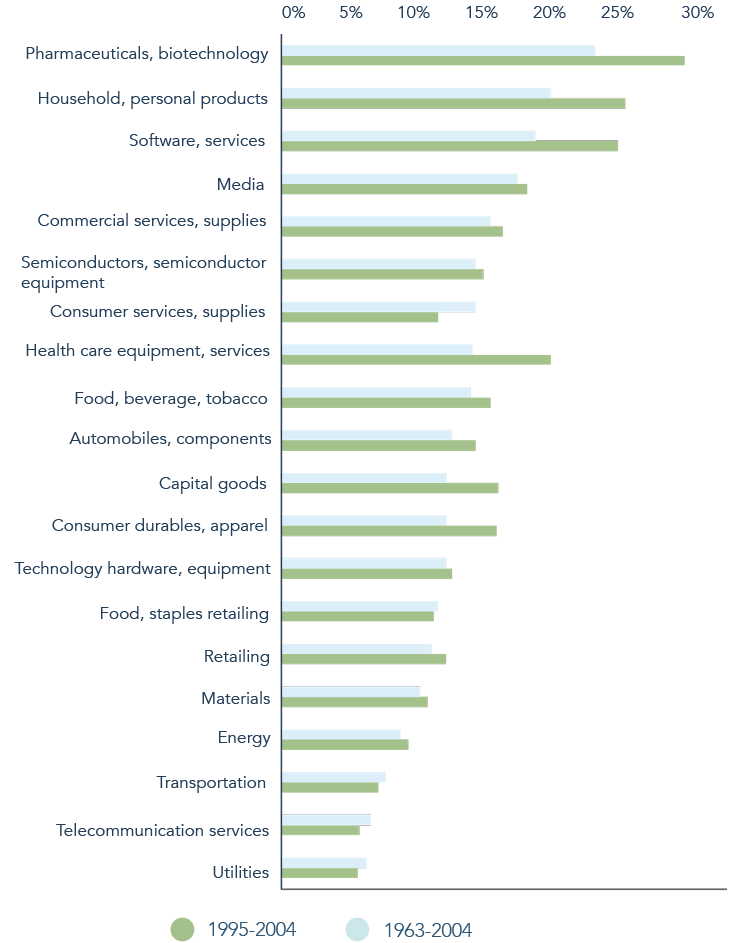
Source: The Mckinsey Quarterly 2006 Number 1. Median annual ROIC, excluding goodwill %.
For many tangible assets, like factories or offices, the primary barrier to replicating them is simply capital. There are some good examples of tangible competitive advantages – e.g. owning a piece of land rich in natural resources[2], or having such vast incumbent scale of tangible assets that the weight of time and capital to compete would be impractical[3]. However, in our experience even these types of companies often have some intangible component as a core part of their success such as reputation or management skill. Tangible investments also come with capital costs – e.g. capital expenditure to construct buildings and machinery which then sit on the balance sheet. Certain tangible-heavy industries are liable to significant ‘capex cycles’ of high spend to refresh or expand their physical operations over time. As a result, these companies can suffer from lower and variable conversion of profit into hard cash. In contrast, we find intangible-heavy companies often have highly attractive financial profiles, with strong cash conversion and ROIC (reflecting high margins and asset turns). Our bias to such businesses is reflected in your Portfolio’s ROIC which sits comfortably in excess of the wider market:
Cash Flow Return On Invested Capital
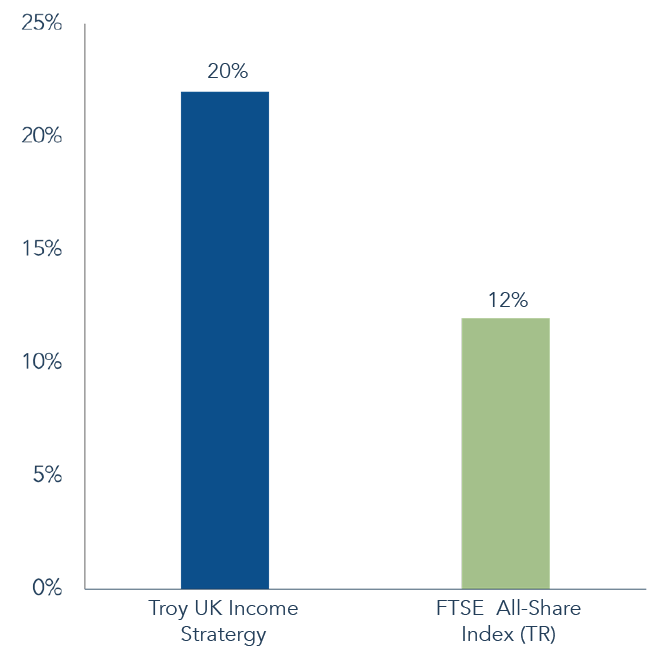
Source: FactSet and FTSE, 31 January 2025. This data excludes banks. Past performance is not a guide to future performance and forecasts are not a reliable indicator of future performance. Cash Flow Return on Invested Capital (CF ROIC) is a measure of financial performance that calculates how efficiently a company’s management is utilising all forms of capital available. All references to benchmarks are for comparative purposes only.
Intangible-focused businesses still have to make significant investments to develop products and sustain competitive advantage[4], however, there are certain aspects of intangibles that we think enable them to produce a more attractive profile of investment over time:
Scalability. Each physical asset has its own production costs and can only be in one place at a time. Intangibles are unbounded from physical limitations and can often scale with little incremental cost. Software is perhaps the best example – for instance, the accounting or payroll software products from portfolio holdings Sage and Paychex can be reproduced and re-used repeatedly while being distributed with ease over the internet. Likewise, future upgrades and innovations can be easily rolled out to all customers. Such business models can demonstrate ‘increasing returns to scale’ with relatively fixed R&D costs spread across a growing revenue base. In contrast, growing your tangible investments such as factories or retail stores comes with proportionate incremental time and capital costs that can preclude rapid expansion.
A related concept frequently seen with intangible assets is their potential to become more valuable as more people use them – so-called network effects. This is most obvious in digital platforms such as the giant social networks (e.g. Facebook or Instagram). Network effects create self-reinforcing cycles of growth and competitive advantage, enabling companies with strong intangible assets to dominate markets and achieve scale with great speed (especially digital-led businesses). In your portfolio, we would highlight names such as LSEG and CME, both of which operate financial exchanges; the more market participants and liquidity on these exchanges, the more attractive they become for current and potential participants, fuelling a virtuous cycle of growth. When one destination gains critical mass, it becomes extremely difficult for competitors to unseat the incumbent. We see similar dynamics at payments network Visa and face-to-face trade show company Informa. Strong network effects often lead to hard-to-disrupt monopolies or oligopolies, enabling strong and consistent growth and ROIC.
Durability is another appeal of intangibles. Tangible assets like machinery or buildings depreciate over time (even with some ‘maintenance’ capital expenditure) and ultimately have a finite life due to wear and tear or obsolescence. Intangibles still require investment, such as marketing or R&D spend for brands, but these can grow the value of the asset over time. Indeed, well-managed brands can have very long lives, with incremental reinvestment reinforcing their strength. The portfolio’s holdings in Consumer Staples giants such as Unilever and Diageo are obvious examples. Decades of brand investment alongside reliable, quality products can build strong reputations and cultivate trust with consumers. Familiarity and trust encourage loyalty and repeat purchases. While Unilever and Diageo must also invest in their tangible footprint (factories, distribution centres etc), intangible reinvestment dominates and it is the intangible assets that are key to the robust long-term ROICs.
We also believe that intangible-focused businesses have greater adaptability, such as in response to technological change. Both RELX and Experian are good examples that have successfully evolved and enhanced their businesses as the world has digitised. We explore Experian in a case study later. Major technology shifts are more difficult for companies with large tangible capital bases as the core of their business. Technological change (which can be fast) has frequently been the downfall of capital-intensive tangible industries – e.g. the disruption of canal owners by the invention of the railway, the horse-drawn carriage industry by the invention of the automobile, or the ongoing decline in physical retail from the rise in ecommerce[5].
Note of Caution
Intangibles are of course still subject to risk. For example, it can be difficult to fully protect some of them. R&D breakthroughs, new software platforms, novel operational methods, or branding/marketing may be replicable by competitors unless protected by patents or copyrights. With software, a new product can make prior versions obsolete. Therefore, while intangibles can lead to vast scale and dominance, such as the emergence of the US-listed tech giants, obsolescence and rapid decline has been the fate for many other technology firms. A related consideration is limited collateral value compared to physical assets like property or machinery. For instance, a failed branded consumer product company may find that marketing expenses are a sunk cost, whereas their manufacturing facility retains some realisable value. By their very nature intangibles are difficult to value; determining the worth of a brand or unique culture is more challenging than for equipment or real estate. Unlike tangible assets, intangibles are rarely recognised on the balance sheet – e.g. marketing or R&D expenses are simply expensed in the income statement[6],[7]. This brings uncertainty when estimating returns on internal investments in such assets, or for acquirers of intangible-heavy companies – one reason why we are cautious about largescale M&A. Looking at this uncertainty positively, we think it is possible for the market to underestimate the persistence and returns of well managed intangible-led businesses.
As with any investment case, it is critical to assess the strength of an intangible derived ‘moat’ and the consequent risk of disruption. Not all intangibles are created equal and some have proved far more durable and harder to replicate than others. Management (or mismanagement) plays a pivotal role, with strategic decisions and capital allocation determining successful evolution over time. We think longstanding portfolio holding Experian provides an interesting case study, both as an enduring intangible-led business and as a microcosm of our evolving economy:
From Tailors’ Ledgers to Big Data: The Lasting Strength of Experian
Experian is the world’s largest credit bureau. It collects, maintains, and analyses data on individuals’ credit histories and financial behaviours. This information is used by customers (including lenders, insurers, retailers, and utility companies) to assess creditworthiness, such as whether someone should be approved for a mortgage or car insurance. Billions of credit decisions are taken annually using Experian’s information – the company is an often invisible but crucial linchpin in our economies. Their enormous database continuously grows, reflecting its ‘contributory’ nature – customers such as banks contribute their consumers’ credit data to the database. They have an incentive to do this because the credit information they then buy from Experian becomes more accurate and useful as more datapoints are aggregated.
Experian’s recent history illustrates the divergent fortunes amidst UK plc and in particular the shifting fortunes of the tangible-heavy retail industry. Experian has been a standalone holding in your portfolio since 2006, when it emerged from UK retail conglomerate Great Universal Stores (GUS) – a once dominant force that counted 25% of British families as customers in the 1960s, and probably the country’s largest lender at the time (a good home for a credit bureau). By 2000, GUS owned (among others) Littlewoods, Argos, Homebase, Burberry, and Experian. Littlewoods was cleaved off in 2005 and has largely vanished in all but name. Argos and Homebase split off as ‘Home Retail Group’ in 2006. This fell in value from £3.5bn to £1.3bn before being sold to Sainsbury’s in 2016. Homebase was sold on twice more, eventually being bought for £1. Meanwhile, Sainsbury’s share price stands at similar levels to that in the 1980s! Burberry was fully demerged in 2005. It has had periods of success but its fortunes have waxed and waned. Experian has been the bright spot, with market value rising from <£6bn in 2006 to c.£35bn today.
The core credit information element of Experian’s business model has a much longer history than its 2006 emergence from GUS. At least as far back as 1803 a group of London tailors started exchanging information on customers who failed to pay their debts. Around 20 years later ‘The Society of Guardians for the Protection of Tradesmen against Swindlers, Sharpers and other Fraudulent Persons’ was formed in Manchester, serving various trades with a printed circular on unreliable customers. This same organisation (which evolved over the years) became a core part of modern-day Experian 150 years later.
The key development of the credit bureau industry was the aggregation and organisation of information about people’s credit histories, producing a valuable, hard-to-replicate dataset. We greatly admire how this intangible asset has endured; from traders informally exchanging information, to paper subscription, to card records read out over the telephone (see photo), and then to email. Today, there are computer servers communicating with each other that output and action credit decisions with minimal human intervention. The intangible asset survived regardless of the medium and indeed grew its value over time.
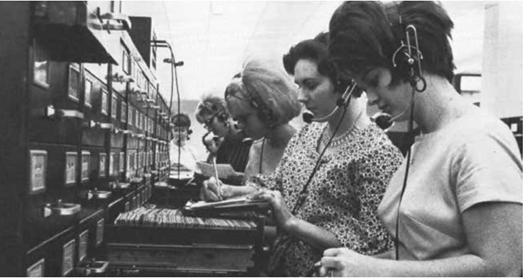
Source: A Brief History of Experian by Nigel Watson
There is a powerful network effect here with high switching costs – the database provides more accurate credit assessment as more consumer information is aggregated, improving the risk profile for users. This fosters trust and drives further adoption of the bureau. Experian’s data feeds and analytics have become deeply embedded in customer workflows and in many instances are mandated by regulators as an industry standard. These factors have trended the credit bureau industry towards monopolies or oligopolies. By our reckoning, Experian is the largest credit bureau in the world, with vast databases on consumers in the US, UK, and Brazil in particular. In the large US market, Experian holds a stable dominant position alongside peers Equifax and TransUnion.
Experian has also been a major beneficiary of technological change. Their database combined with deep know-how, talented technology staff, and software have enabled Experian to rapidly innovate in the modern era – developing advanced analytical methods, applying its data to novel industries, and speeding up distribution of their products. We are seeing the fruits of these synergies in today; Experian’s growth and profitability are on strong and improving trajectories. Given their leading position, when Experian acquires other data assets, these are often of greater value to them versus other would-be acquirers; Experian bought a leading credit bureau in Brazil in 2007 – by applying their existing expertise, know-how, and software products to this enormous emerging credit market, they have created a dominant (c.2/3rds market share) and rapidly growing business – a compelling display of agility and scalability.
Is Experian liable to some of the risks around intangibles we discussed? There have been many would-be disruptors, however, by lacking a comparable database (among other intangibles like reputation) they have failed to dent Experian’s market share. Experian must still keep up its own innovation to demonstrate its value to customers vs alternatives, but we are comfortable in the strength of the core dataset and network effect.
We would also highlight how defensive the revenues and cash flows from Experian have proved – the word ‘credit’ may cause concern that this business is liable to big swings depending on the wider ‘credit cycle’. However, we now have almost two decades of public data to demonstrate the resilient demand for Experian’s products, even through the so-called ‘credit crunch’. We must also acknowledge management skill and a culture of continuous product innovation for this remarkable track record. Experian has been one of the top contributors to the portfolio’s long-term returns as a result of this compounding value creation.
Organic Growth Revenue
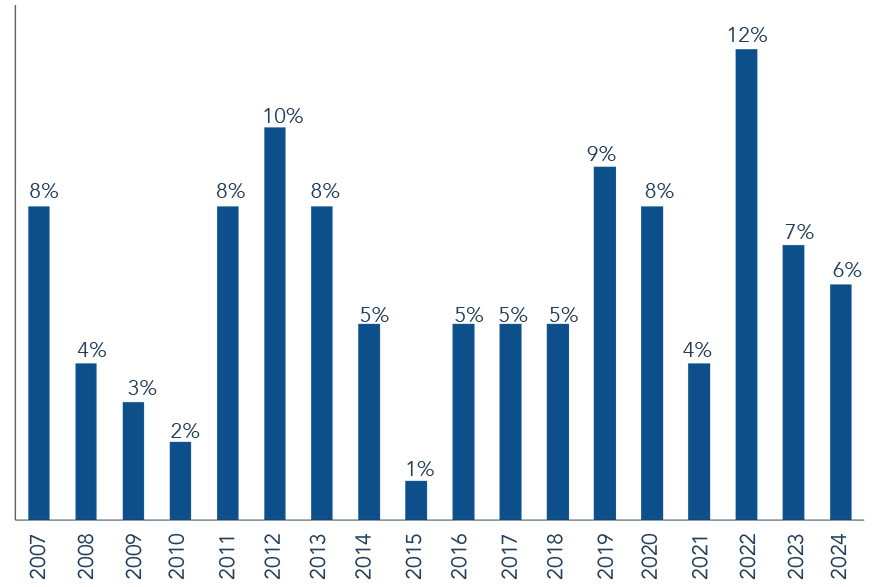
Source: Company data, 31 January 2025. Past performance is not a guide to future performance.
Conclusion
We hope this letter provides some insight into why Troy favours intangible-led business models. In reality, most businesses may combine some element of intangible and tangible assets; Consumer Staples is one example, Compass Group (featured in our last newsletter) is another – huge physical scale is an additional barrier to entry alongside reputation, valuable customer relationships, and management skill. But intangibles are central to Troy’s investment choices, with their unique qualities enabling truly enduring businesses with exceptional cash generation. Crucially, as the trends at the start of this letter highlight, they matter even more today. With technology’s accelerating role, asset-light intangible-driven companies are likely to be where we will find some of the most compelling sources of growth and returns.
[1] Capitalism Without Capital: The Rise of the Intangible Economy by Jonathan Haskel, Stian Westlake
[2] A good example we know is Texas Pacific Land Corporation – a company that owns 880,000 acres of land in the resource-rich Permian Basin in West Texas. It makes money predominantly through royalties earned from companies extracting oil, gas, and water on its land.
[3] Such as the North American railroad companies.
[4] Typically expensed through the income statement instead of capitalised expenditure on the balance sheet
[5] We recommend the deeply researched book Engines That Move Markets by Alasdair Nairn, exploring such shifts, from canals all through to the internet.
[6] Interestingly, when a company is acquired, accounting rules dictate that the buyer must try to put a value on intangible assets such as brands. The Coca-Cola Company today has no explicit intangible asset on its balance sheet to represent the $ value of the ‘Coca-Cola’ brand. However, if it was to be acquired by e.g. PepsiCo, accountants would try to ascribe a value to it – an inexact task!
[7] This has important implications for valuation metrics – for example, intangible-heavy companies often look expensive on traditional metrics such as Price-to-Book, however, this can simply reflect that the ‘Book’ value of assets on the balance sheet is minimal.
Please refer to Troy’s Glossary of Investment terms here. The information shown relates to a mandate which is representative of, and has been managed in accordance with, Troy Asset Management Limited’s UK Income Strategy. This information is not intended as an invitation or an inducement to invest in the shares of the relevant fund.
Performance data provided is either calculated as net or gross of fees as specified in the relevant slide. Fees will have the effect of reducing performance. Past performance is not a guide to future performance. All references to benchmarks are for comparative purposes only. Overseas investments may be affected by movements in currency exchange rates. The value of an investment and any income from it may fall as well as rise and investors may get back less than they invested. Neither the views nor the information contained within this document constitute investment advice or an offer to invest or to provide discretionary investment management services and should not be used as the basis of any investment decision. There is no guarantee that the strategy will achieve its objective. The investment policy and process may not be suitable for all investors. If you are in any doubt about whether investment policy and process is suitable for you, please contact a professional adviser. References to specific securities are included for the purposes of illustration only and should not be construed as a recommendation to buy or sell these securities.
Although Troy Asset Management Limited considers the information included in this document to be reliable, no warranty is given as to its accuracy or completeness. The opinions expressed are expressed at the date of this document and, whilst the opinions stated are honestly held, they are not guarantees and should not be relied upon and may be subject to change without notice. Third party data is provided without warranty or liability and may belong to a third party.
All references to FTSE indices or data used in this presentation is © FTSE International Limited (“FTSE”) 2025. ‘FTSE ®’ is a trade mark of the London Stock Exchange Group companies and is used by FTSE under licence.
Issued by Troy Asset Management Limited, 33 Davies Street, London W1K 4BP (registered in England & Wales No. 3930846). Registered office: 33 Davies Street, London W1K 4BP. Authorised and regulated by the Financial Conduct Authority (FRN: 195764) and registered with the U.S. Securities and Exchange Commission (“SEC”) as an Investment Adviser (CRD: 319174). Registration with the SEC does not imply a certain level of skill or training. Any fund described in this document is neither available nor offered in the USA or to U.S. Persons.
© Troy Asset Management Limited 2025.